ORIGINAL RESEARCH
Construction of a Big Data-Driven Predictive Analysis Platform for Hospital Talent Attrition
Xiao Lei Zheng1  , Xiaoli Dai1 and Tian Li Liu2
1Qingdao Traditional Chinese Medicine Hospital, Qingdao Hiser Hospital Affiliated of Qingdao University, Shandong, China; 2Shandong Qingdao Hospital of Integrated Traditional Chinese and Western Medicine, Shandong, China
Keywords: Hospital turnover, machine learning, negotiable fate, organizational citizenship behavior, psychological capital, random forest, SMOTE, Synthetic Minority Class Oversampling Technique
Abstract
Objective: This study develops a big data-driven predictive platform for hospital staff attrition, integrating machine learning (ML) with psychological constructs. Negotiable Fate (NF), a culturally rooted belief system, is examined as a predictor of turnover via psychological capital (PC) and organizational citizenship.
Methods: Structured HR data from 400+ employees at a tertiary public hospital, covering 20+ features, were analyzed. Due to attrition imbalance (~5%), SMOTE was applied to balance the dataset. Four ML classifiers—logistic regression, decision tree, random forest, and XGBoost—were evaluated using accuracy, precision, recall, and F1-score. Statistical analyses assessed mediation, moderation, and construct validity using survey variables: NF, PC, perceived organizational support, job performance (JP), and organizational citizenship behavior.
Results: Random Forest and XGBoost achieved superior recall for attrition cases. Feature importance consistently highlighted working hours, income, job type, and satisfaction as key predictors. NF significantly predicted JP (β = 0.30, p < 0.001) and organizational citizenship (β = 0.36, p < 0.001) through PC (β = 0.33, p < 0.001). Perceived organizational support moderated the NF → PC pathway (β = 0.16, p < 0.001), confirming mediated moderation.
Conclusion: Integrating ML with psychological theory enhances both the prediction and understanding of hospital staff attrition. The platform enables culturally sensitive, data-driven HR interventions, helping administrators identify high-risk employees and implement targeted strategies to reduce attrition, stabilize the workforce, and improve patient care.
Plain Language Summary
Rapid industrial growth in China’s Yangtze River Delta has increased hazardous waste and raised environmental risks. Because provinces manage waste separately, supervision is inconsistent, allowing illegal dumping to persist. This study develops a smart cross-regional supervision and early warning platform to address these issues. Using electronic tracking, IoT monitoring, and big data analytics, the system follows hazardous waste in real time and detects abnormal or high-risk activities.
Analyzing panel data from 2015–2024, we find that the platform cuts illegal dumping by about five cases per province annually and improves proper waste disposal by 4–5 percentage points. It also predicts high-risk shipments accurately, supporting faster intervention and safer industrial development.
Citation: Blockchain in Healthcare Today 2025, 8: 433.
DOI: https://doi.org/10.30953/bhty.v8.433
Copyright: © 2025 This is an open-access article distributed in accordance with the Creative Commons Attribution Non-Commercial (CC BY-NC 4.0) license, which permits others to distribute, adapt, enhance this work non-commercially, and license their derivative works on different terms, provided the original work is properly cited and the use is non-commercial. See http://creativecommons.org/licenses/by-nc/4.0. The authors of this article own the copyright.
Submitted: July 24, 2025; Accepted: November 8, 2025; Published: December 31, 2025
Corresponding Author: Xiaoli Dai, Email: XiaoLiDai1@outlook.com
Competing interests and funding: The authors declare no conflicts of interest with respect to the research, authorship, and publication of this article.
No funding was accepted for the preparation of this article.
Attrition among hospital employees is a critical challenge to global healthcare systems, significantly affecting service continuity, patient outcomes, and institutional knowledge retention.1,2 Particularly in large public hospitals, the departure of trained medical professionals, including nurses, physicians, and administrative personnel, incurs not only high recruitment and onboarding costs but also disrupts workflow efficiency and compromises care quality.3 While traditional human resource (HR) strategies attempt to retain talent through monetary incentives or periodic satisfaction surveys, these approaches often fail to capture the complexity and dynamics of employee turnover behaviors, especially in high-stress medical environments. Therefore, the construction of a data-driven predictive platform to anticipate talent attrition has become both urgent and essential.4,5
With the advent of big data and artificial intelligence (AI) technologies, healthcare institutions are now equipped with the technical infrastructure to collect, integrate, and analyze large volumes of personnel-related data. These data range from demographic information, job satisfaction ratings, and performance evaluations to psychological profiles and system-level policies.6 However, leveraging these multi-dimensional data sources to accurately model and predict turnover risks remains a non-trivial task. Hospital workforce attrition is influenced by a mixture of controllable and uncontrollable variables, such as personal motivation, organizational support, healthcare reform, and even unforeseen public health emergencies (e.g. pandemics). A purely statistical approach fails to capture these heterogeneous influences, while black-box ML models often lack interpretability and generalizability across diverse clinical settings.7,8
Current literature reflects a growing interest in predictive modeling of employee turnover using ML algorithms. For instance, classification methods such as logistic regression, decision trees, and ensemble models like random forest or Gradient Boosting Tree (XG Boost) have been applied across sectors including education, business, and government.9 In the healthcare domain, most prior studies focus on clinical outcome predictions, patient readmission, or disease risk stratification, while comparatively fewer works have addressed human capital dynamics within hospitals.10 Even among existing attempts, key limitations remain, including (1) severe class imbalance due to low attrition rates skews model performance, (2) psychological and behavioral factors, such as beliefs about fate or workplace identity, are often ignored, and (3) most frameworks lack practical implementation mechanisms for real-time warning and intervention.
To bridge these gaps, this article introduces a novel, hybrid platform that integrates big data analytics, machine learning (ML), and psychological attribution modeling to predict hospital employee attrition. Our approach is unique in three key aspects. First, we introduce the concept of negotiable fate (NF), a culturally embedded psychological belief that mediates between fatalism and agency, as a core explanatory factor in modeling employee departure. While previous literature in organizational psychology has highlighted the predictive power of locus of control and PC on job outcomes,11,12 our study is among the first to embed this belief system into a hospital attrition forecasting framework. NF posits that although fate (e.g. external constraints) sets boundaries, individuals can still negotiate outcomes through effort within these boundaries, offering a balanced cognitive model between resignation and empowerment.
Second, we construct a multi-stage ML pipeline trained on real-world HR data from a Class A tertiary hospital.13 The dataset includes over 400 effective employee records with more than 20 structured variables such as working years, attendance, income, satisfaction ratings, and performance. Due to the highly skewed class distribution (only ~5% attrition), we adopt the Synthetic Minority Oversampling Technique (SMOTE) to rebalance the data, ensuring that minority class patterns are not ignored during training. The model suite includes logistic regression for interpretability, decision trees for rule-based learning, random forest for robustness, and XG Boost for handling feature interactions. Evaluation metrics such as precision, recall, and F1-score are emphasized over mere accuracy to reflect performance under imbalance.14,15 Jayaprakasam and Cindhamani16 focus on integrating big data, AI, and cloud computing to enhance healthcare system scalability. Similarly, in the proposed work “Construction of a Big Data-Driven Predictive Analysis Platform for Hospital Talent Attrition,” big data and AI are adopted, using ML models like Random Forest and XGBoost to predict hospital staff attrition. This integration improves predictive accuracy, real-time data processing, and scalability, empowering hospital administrators to proactively manage talent retention and reduce attrition.16
Third, we extend the modeling framework by incorporating PC and perceived organizational support (POS) as mediators and moderators in the attrition mechanism. Through a large-scale survey and structured questionnaire, we assess five latent constructs: NF, PC, perceived support, job performance (JP), and organizational citizenship behavior (organizational citizenship behavior). Using hierarchical regression and PROCESS-based interaction modeling, we demonstrate that PC partially mediates the relationship between NF and both performance and organizational citizenship behavior, while POS strengthens the impact of NF on PC. These insights are statistically validated through confirmatory factor analysis (CFA), reliability tests (Cronbach’s r > 0.80), and correlation analysis (r > 0.40 for key paths).17,18 Naresh19 utilizes various regression techniques and ML models to forecast sales trends. In the proposed work “Construction of a Big Data-Driven Predictive Analysis Platform for Hospital Talent Attrition,” similar ML models like Random Forest and Gradient Boosting are adopted to predict hospital employee attrition. This integration enhances prediction accuracy, models complex HR patterns, and enables data-driven strategies for talent retention, optimizing workforce management, and improving hospital stability.19 The contributions of the paper include the following:
- To establish a data-psychology integrated modeling paradigm that combines algorithmic prediction with cognitive theory, enriching the interpretability and actionability of attrition forecasts.
- The platform demonstrates the practical utility of the platform through visualizations (e.g. decision trees, feature importance ranking, attrition heatmaps), enabling HR managers to pinpoint high-risk employees.
- Propose a theoretical pathway where the belief in NF affects turnover through psychological resilience and organizational commitment, offering empirical support for culturally sensitive talent management.
After Section 1, this article is organized as follows: (1) the connection between employee performance and NF—the theoretical basis, dataset description, data imbalance handling, segmentation, and ML models; (2) Research Methods and Statistical Analysis—measurement tools, reliability/validity tests, descriptive statistics, correlation, regression, and hypothesis testing; and (3) Experiment—experiments designed, data sources, regression results, hypotheses, and forecasting performance; and Conclusions summarizing findings and implications.
The Connection Between Employee Performance and Negotiable Fate
NF is also an individual belief system. In the context of hospital staff turnover, NF refers to the belief that while fate (such as systemic constraints or institutional policies) plays a role in influencing outcomes, individuals can still exercise their agency and take proactive actions within the boundaries set by these uncontrollable factors.20,21 According to the attribution theory, beliefs shape how individuals assign causes to events and how they respond to the results.
Medical professionals with a strong sense of internal control are more likely to take personal credit for successes and feel greater shame over failures, demonstrating attributional polarization. However, in the hospital work environment, staff turnover is often influenced by a combination of controllable (e.g. work satisfaction, leadership style) and uncontrollable (e.g. hospital reforms, public health crises) factors. The NF perspective acknowledges this duality—partially attributing turnover to external fate-like forces while still emphasizing individual agency.22,23 Compared to extreme internal attribution bias, NF offers a more balanced and realistic framework for understanding and addressing hospital workforce attrition.24
The overall theoretical model is shown in Figure 1, which illustrates a complete ML modeling process for hospital attrition prediction. First, from the original attrition dataset characterized by category imbalance, the minority class (departing employees) is expanded using SMOTE to generate new synthetic samples to alleviate the category imbalance problem. Subsequently, the balanced data are divided into a training set (80%) and a validation set (20%) for model training and performance evaluation. In the model construction phase, several classical supervised learning algorithms, including Decision Tree, Random Forest, Logistic Regression, and Extreme Gradient Boosting Tree (XG Boost) are used to binary classify the modeling of whether employees turnover or not. After the model training is completed, the model performance is comprehensively judged by constructing a confusion matrix and evaluating metrics such as prediction accuracy, precision, recall, and F1 score. Finally, the model labels each employee as “Yes” or “No” and presents them in color differentiation, providing HR managers with visual early warning decision support.

Fig. 1. Conceptual diagram of the model. FN: false negative; FP: true negative; ML: machine learning; TN: true negative; TP: true positive.
Data Sets and Imbalances
The hospital brain drain dataset used in this study was obtained from the HR information system of a tertiary care hospital, covering a number of dimensional variables such as employees’ basic information, job category, years of service, performance appraisal, attendance records, training participation, and satisfaction surveys. After data preprocessing, a total of NN valid employee records were obtained, including continuous variables (e.g. years of service, performance scores) and category variables (e.g. department, job type, etc.).25
In terms of target variables, this study focuses on whether employee turnover occurs in a specific future time window (e.g. the next 3 or 6 months), which is labeled using a dichotomous approach: if an employee voluntarily separates or resigns during the observation cycle, it is recorded as 1 (turnover), otherwise, it is recorded as 0 (no turnover). The fact that most of the employees remain on board during the study cycle results in an extreme imbalance in the positive and negative sample proportions.26
Let the original data set be:

Where xi denotes the feature vector of the second employee, yi = 1 means that the employee is churned, and yi = 0 means that the employee is not churned. Let N0 and N1 denote the sample sizes of the majority class (no turnover) and the minority class (turnover), respectively, which clearly exist:

Through statistical analysis, it was found that the percentage of departing employees was only about 5%, that is:

This suggests that the data are extremely skewed, and without processing, the trained model may be “overly conservative” in its predictions, that is, predicting “no turnover” almost exclusively to obtain an apparently high accuracy rate, but actually neglecting to identify the real employees who have left the company. The ability to identify the real employees who have left the company is actually neglected.
In addition, the sample distribution visualization shown in Figure 1 (bar charts or t-SNE downscaling charts are recommended) also reflects the differences in the number of categories. This category imbalance problem poses a significant challenge to the model performance, which is mainly manifested in the following ways: low recall: the model is unable to effectively identify the minority class (turnover employees); imbalance of evaluation metrics: the traditional accuracy loses its significance, and more robust metrics, such as F1-score, are needed; and shifted decision boundaries: the training is biased towards the majority of the classes, resulting in distorted discriminative boundaries.
Synthetic Minority Oversampling Technique
To alleviate the problem of category imbalance, we employ the SMOTE technique to oversample the minority categories.27 SMOTE obtains synthetic samples by linearly interpolating between the minority samples and their nearest neighbors.
Specifically, let xi be a minority class sample and xzi be one of its kk-nearest neighbors, and the new sample generated by SMOTE is:

The final balanced dataset is:

From the results of attribution, the reason why individuals with internal control personality show better JP, career success, and lower job burnout is that the belief of internal attribution meets their needs of self-improvement, self-protection, and sense of control.28 Based on the attribution theory, the locus of control theory29 holds that individuals with internal control personality are proud of success and ashamed of failure compared to those with external control. Individuals with internal control have higher task performance. Individuals with internal control also experience more job happiness in work scenes,30 showing higher career success, job autonomy and lower job burnout, turnover intention, and job stress.
Correlations between beliefs and heart capital:
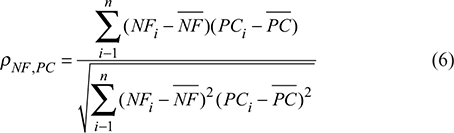
where NFi is the NF value of the ith sample and PCi is its psychological capital (PC) value.
Regression modeling: the relationship between heart capital and NF

α0 and α1 are regression coefficients and òi is the error term.
Regression modeling: the relationship between JP and NF

β0 and β1 are regression coefficients and vi is the error term.
Regression modeling: the relationship between organizational citizenship behavior and negotiable destiny

γ0 and γ1 are regression coefficients and xi is the error term.
However, individuals with the negotiable belief in fate can still satisfy self-improvement and self-protection and gain an effective sense of control, although they can recognize their fate. Therefore, NF can promote individuals to show better JP. Because individuals who can negotiate their fate can make reasonable attributions, they can show more active behaviors, exert their controllable factors, and constantly expand the scope of controllable factors to get the best results. Therefore, individuals with an NF will keep a positive working attitude and be more willing to pursue organizational citizenship behaviors beyond the job requirements.
Data Segmentation
After completing the unbalanced processing of the original data, the balanced dataset DSMOTE is obtained, which already contains the original majority class samples, the original minority class samples, as well as the synthetic minority class samples generated by the SMOTE technique. In order to guarantee the scientific validity and generalization ability of model training and evaluation, we divide the whole dataset into two non-overlapping subsets, that is, the training set and the validation set.
The specific division strategy is as follows:
- Training set (80%): used for model training and parameter learning, denoted as Dtrain. Our study validated the models using an 80–20 train-test split strategy, ensuring the training set consisted of 80% of the data, while 20% was reserved for testing
- Validation Set (20%): used for model evaluation, denoted as Dval.
The validated models use k-fold cross-validation to assess the model’s generalization performance.
In the partitioning process, we adopt stratified sampling to maintain the consistency of the category distribution in the two subsets. Even after the SMOTE balancing process, it is necessary to ensure that the ratio of positive and negative samples in the training set and validation set is approximately equal, so as to avoid performance fluctuations due to category skewing during the evaluation process.
In addition, this study sets random seeds during the division to ensure the reproducibility of the experiment. After the division of the training set is completed, all model training processes rely only on Dtrain, while the performance evaluation metrics (e.g. accuracy, precision, recall, and F1 scores) are uniformly compared on Dval, which ensures the consistency of the evaluation standard and the fairness.
In the subsequent process of model selection and hyperparameter tuning, the k-Fold Cross-Validation (K-Fold) mechanism can be introduced if further stability improvement is needed, but in this article, in order to simplify the analysis, the initial model comparison is first based on the fixed validation set division.
Machine Learning Models
In order to realize the accurate prediction of whether there is a turnover risk of hospital employees, this article selects four classical supervised learning algorithms to construct a binary classification model, namely: Decision Tree, Random Forest, Logistic Regression, and XG Boost. These models have good performance in dealing with structured data and classification tasks and have the advantages of high interpretability, fast training speed, or high generalization ability. Figure 2 illustrates the process of predicting whether employee turnover is likely to occur or not using hospital workforce data with multiple ML models (Decision Tree, Random Forest, Logistic Regression, and XG Boost). The input is the hospital’s human data, and after the independent learning and prediction process of multiple models, the final classification result is output: “Yes” (turnover) or “No” (no turnover). This process can be used for HR early warning and talent retention strategy development.

Fig. 2. Hospital brain drain prediction based on multi-model integration.
The essential goal of each model is to learn a binary classification function:

where Rd denotes the employee’s feature space (e.g. age, position, length of service, performance ratings, etc.), and the output  denotes the prediction of the employee’s turnover status: 1 means that turnover is imminent, and 0 means that the employee will continue to stay on.
Logistic Regression
Logistic regression is a linear model widely used in binary classification problems, especially for scenarios with high interpretability requirements. It assumes that there is a linear relationship between the predictor variables and the target variables and maps the predicted values to the interval (0, 1) through the sigmoid function, which represents the probability of employee turnover.
Its prediction function is:

where x ∈ Rd is the employee’s eigenvector and ww is the model parameter vector.
Final Output Decision:

where the threshold τ = 0.5 is usually the default setting and can be adjusted according to the task sensitivity needs.
In hospital turnover scenarios, logistic regression can help identify the characteristic factors (e.g. work intensity, satisfaction) that are most likely to lead to employee turnover, with good explanatory power.
Decision Tree
Decision trees achieve classification of samples by learning a series of “if-then” rules based on feature partitioning and splitting the data up to the leaf nodes. Its advantages are clear model structure, easy visualization, and no need for feature standardization.
In hospital manpower forecasting, the decision tree can show which variables trigger the earliest “potential turnover” judgment through a hierarchical way, such as “whether the performance is below 80 points for 3 consecutive months” or “whether the employee takes leave frequently,” and so on.
Random Forest
Random Forest is an integrated learning approach that can significantly reduce the risk of overfitting in single-tree models by constructing multiple decision trees (base learners) and voting (majority voting) to improve the overall prediction performance.
Each tree is trained using a random subset of data and features, which improves the generalization ability of the model. Its output probability is the average prediction of all trees:
where T is the total number of trees in the forest and ft(x) is the prediction of sample xx by the t-th tree.
In hospital brain drain modeling, random forests are robust to high-dimensional features, applicable to the presence of noise in the scene, and often used to do feature importance assessment (Feature Importance).
The Gradient Boosting Tree (Xg Boost)
XG Boost is an enhanced decision tree model based on the gradient boosting framework, which is widely used for its excellent accuracy and computational efficiency. It optimizes the loss function in an iterative manner, where each round of the model learns the direction of the prediction residuals of the previous round, thus achieving a gradual reduction of the error.
Its core objective function is as follows:
where l(·) is the loss function, Ω(·) is the regular term, and ft is the t-th newly learned regression tree.
In the hospital manpower scenario, XGBoost can effectively handle feature interactions and nonlinear relationships, and is suitable for mining complex combinations of turnover risk factors (e.g. “high seniority + moderate performance + many night shifts”).
All four models take the balanced training set Dtrain as input, and build the prediction function f(x) by learning the historical turnover behaviors and employee characteristics. The model effect is evaluated on the validation set Dval, and the best performance is selected as the final churn prediction tool by comparing the models through the metrics of accuracy, precision, recall, and F1-score. The prediction results will be used to provide early warning suggestions to the hospital management, such as identifying high-risk employees in advance and formulating intervention strategies such as motivation, training, and transferring to reduce the loss of key talent.
Final Predicted Output
After training and evaluation, the model outputs binary prediction results for each employee:

Predicted results are visualized as red and green labeled outputs, with red representing employees predicted to turnover and green representing employees predicted to stay, making it easy for management to quickly identify key interventions.
Research Methods and Statistical Analysis
Measurement
Hospital Employee Turnover: In this study, we measured employees’ intention to leave and related psychological variables through a questionnaire. The Negotiable Fate Belief (NFB) was measured using a six-item scale validated in the literature to assess employees’ perceptions of the relationship between fate and autonomy in the face of hospital work stress and career uncertainty. Sample questions included, “When I have a setback in my hospital job, it is difficult for me to recover from it and move on. I try to solve whatever problems I encounter at work, etc.
All items were scored on a Likert 7-point scale (1 = “Strongly Disagree,” 7 = “Strongly Agree”). Respondent employees rated the items based on their actual work experience, with higher scores indicating a greater tendency to believe that individuals still have the ability to change outcomes in a given environment, that is, demonstrating a higher level of belief in negotiating fate.
In addition, the survey included dimensions such as employees’ basic information (age, length of service, position, education, etc.), job satisfaction, sense of organizational support, and performance evaluation, in order to further establish a comprehensive assessment system of employee turnover tendencies.
Statistical Analysis
Before formal modeling and prediction, this paper first examines the reliability of all measured variables. Table 1 presents the Cronbach’s Alpha coefficients for each of the main variables to assess the internal consistency of the scales. The results show that the Alpha values of all core variables are higher than 0.7, indicating that the scales used in this study have good reliability and can meet the requirements of subsequent statistical analysis and model training.
The subsequent analysis steps include:
Descriptive Statistics: to examine the mean, standard deviation, and skewed distribution of variables include the following:
- Pearson Correlation: to explore the linear correlation between different variables;
- Variance Inflation Factor: to control the redundancy between features;
- Variable Standardization and Numerical Coding: for model inputs;
- Unification Process;
- Data set division and balancing before modeling: to solve the category balancing problem by SMOTE technique;
- Finally, to the ML model construction and prediction stage. Unification processing;
- Data set division and balancing processing before modeling: solving the problem of category imbalance by SMOTE technique;
- Finally entering the ML model construction and prediction stage.
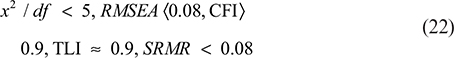
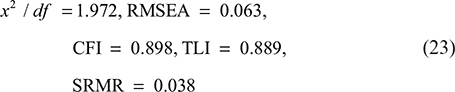
All of the variables in this study underwent CFA using the Mplus 8.0 program. Five indicators, including the chi-square ratio/degree of freedom, standardized root mean square residual (SRMR), root mean square error of approximation (RMSEA), comparative fit index (CFI), and the Tucker Lewis Index (TLI) are chosen to represent the degree of model fitting. PC and organizational citizenship behavior are packaged based on the dimensions. Table 2 shows that the five-factor model is better than other alternative models and satisfies the important requirements, with χ2/df < 5, RMSEA < 0.08, CFI > 0.9, TLI around 0.9, and SRMR < 0.08. As a result, the measurement model has strong discriminatory validity since the five-factor model has the best model fitting degree.
Thus, we modeled the pertinent material based on the data analysis that Cronbach is Alpha for Negotiable Fate:

Cronbach is Alpha for Psychological Capital:

Cronbach is Alpha for Perceived Organizational Support:

Cronbach is Alpha for Job Performance:

Cronbach is Alpha for Organizational Citizenship Behavior:

The mean, standard deviation, and correlation coefficient of the primary variables are compiled in Table 3. The findings indicate a moderate relationship between NF and PC (r = 0.559, p < 0.00), work performance (r = 0.469, p < 0.00), POS (r = 0.448, p < 0.00), and organizational citizenship behavior (r = 0.503, p < 0.00).
In this study, SPSS for Windows 22.0 software and process plug-in16 are used for hypothesis testing, mediating effect, and moderating effect analysis. Firstly, this study uses SPSS to make hierarchical regression (see Table 4 for the results).
Hierarchical Regression and Interaction Effect Modeling
Model 2 tests the relationship between employees’ NF and PC. Model 3 looks at how PC is affected by the relationship between employees’ NF and POS. After regulating the negotiated fate, model 6 looks at how PC affects JP. Model 7 looks at how JP is affected by the relationship between peoples’ NF and their perception of organizational support. Once the NF has been controlled, model 6 looks at how PC affects organizational citizenship behavior. Model 7 looks at how employees’ NFs interact with one another.
For the evolution of Eq: Model Fit Criteria:
Best Five-Factor Model Fit Results:
Correlation Between Negotiable Fate and Perceived Organizational Support:

Correlation Between Negotiable Fate and Psychological Capital:

Correlation Between Negotiable Fate and Job Performance:

Results of Hypothesis Testing and Regression Analysis
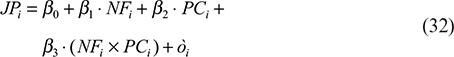
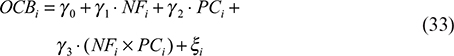
Model 5 in Table 4 indicates that the NF significantly improves job performance (b = 0.3, p < 0.0, R2 = 0.3), and that hypothesis 1a is true. The model 9 shows that NF (b = 0.36, p < 0.0, R2 = 0.36), and hypothesis 1b holds. Model 2 demonstrates that PC is significantly enhanced by NF (b = 0.33, p < 0.0, R2 = 0.47), and hypothesis 2 is true. Model 6 shows that PC positive effect (b = 0.37, p < 0.0, R2 = 0.37), and hypothesis 3a, holds. Model 10 demonstrates that organizational citizenship behavior is significantly positively impacted by PC (b = 0.49, p < 0.0, R2 = 0.49). Hypothesis 3b is true. The model 3 shows that the interaction between NF and POS has a significant positive effect on PC (b = 0.16, p < 0.0, R2 = 0.5). Hypothesis 5 is valid. Model 7 shows that the interaction between NF and POS does not have a significant predictive effect on JP (b = −0.05, p = 0.402). Similarly, Model 11 shows that the interaction between NF and POS is not significant (b = 0.08, p = 0.134).
Finally, the whole correlation variable’s expression is obtained; Correlation Between Negotiable Fate and Organizational Citizenship Behavior:

Regression Coefficient of Negotiable Fate on PC:

Regression Coefficient of Negotiable Fate on Job Performance:

Regression Coefficient of Negotiable Fate on Organizational Citizenship Behavior:

POS’s Moderating Impact on the Association Between Psychological Capital and Negotiable Fate:

Interaction effects: how psychological capital and negotiated fate interact to affect job performance.
Interaction effects: how psychological capital and negotiated fate interact to influence organizational citizenship behavior.
Regression analysis: how psychological capital affects work performance.

The impact of psychological capital on organizational citizenship behavior using a regression model.

Using the bootstrap sampling method and a process plug-in created according to Ref.,17 we investigate whether PC mediates the relationship between NF and JP and organizational citizenship behavior (hypothesis 4), as indicated in Table 5. The findings confirm hypothesis 3a by demonstrating that the indirect effect of PC between NF and JP is 0.251.95%, with an unbiased confidence interval of (0.169, 0.342) that does not contain 0. Hypothesis 3b is supported by the indirect effect of PC between NF and organizational citizenship conduct, which is 0.335. The 95% unbiased confidence interval for this effect is (0.225, 0.453), which does not contain 0. PC is positively and significantly impacted by the relationship between negotiated fate and POS. The 95% unbiased confidence interval is (0.086, 0.366), and the interaction term impact value is 0.225. The hypothesis is supported if it does not pass through 0 since this indicates that the moderating impact is considerable (Figure 1 displays the diagram of interaction effect). NF has a mediated moderating effect of 0.074 on work performance, with a 95% unbiased confidence interval of (0.027, 0.132). The mediated moderating impact is considerable if it does not pass through 0. The 95% unbiased confidence interval for the mediated moderating effect of organizational citizenship behavior is (0.035, 0.161), with a value of 0.092. It indicates that the mediated moderating impact is significant if it does not pass through 0.
| Variable | Items (n) | Example item | References | Cronbach’s α |
| Negotiable fate belief | 6 | “When encountering difficulties at work in the hospital, I still try to solve them.” | 16 | 0.83 |
| Psychological capital | 8 | “I believe I have the ability to accomplish my hospital work tasks.” | Luthans et al. | 0.87 |
| Job performance | 4 | “I can always efficiently complete the tasks required by my position.” | Williams & Anderson | 0.82 |
| Organizational citizenship behavior | 5 | “I am willing to help colleagues solve problems.” | Podsakoff et al. | 0.85 |
| Perceived organizational support | 6 | “The hospital cares about my development.” | Eisenberger et al. | 0.88 |
Regression modeling: the effect of gender on JP

Regression modeling: the effect of years of service on organizational citizenship behavior

Model evaluation: Cronbach’s Alpha Calculation
Multiple regression modeling: the effect of control variables on heart capital

Multiple regression modeling: the effect of control variables on JP

Experiment
Experimental Design and Research Framework
This study focuses on the mechanism of brain drain in hospitals, constructs an impact model with NF as the main variable, explores its mediating path through PC to influence JP and Organizational Citizenship Behavior (organizational citizenship behavior), and further analyzes the moderating and moderating mediating effects of POS in this path. This study examines citizenship behavior (organizational citizenship behavior) through PC and further analyzes the moderating and moderated mediation effects of POS along this pathway.
The research hypothesis path diagram is:
H1a: Negotiable Fate → Job Performance (Positive)
H1b: Negotiable Fate → Organizational Citizenship Behavior (Positive)
H2: Negotiable Fate → Psychological Capital (Positive)
H3a: Psychological Capital → Job Performance (Positive)
H3b: Psychological Capital → Organizational Citizenship Behavior (Positive)
H4a/H4b: Mediating Effects of Psychological Capital in the H1a and H1b
H5: POS Moderating Negotiable Fate → Psychological Capital Path (Moderating Effect)
H6a/H6b: Moderating Mediating Effect of POS in Mediating Paths
Variable Measurement and Data Sources
Data were collected from the medical, administrative, and nursing staff of a large public hospital using a structured questionnaire. There were 427 questionnaires distributed, and 402 valid questionnaires were collected (validity rate 94.15%). Likert 7-point scale (1 = “strongly disagree,” 7 = “strongly agree”) was used as the measurement tool. Table 5 shows the measurement indicators and reliability analysis of each research variable.
Data Preprocessing and Reliability Tests
All variables were analyzed for reliability by SPSS, and the Cronbach’s alpha values were higher than 0.80, showing good internal consistency. The correlation between variables was significant and satisfied the prerequisites of regression analysis.
The Pearson’s correlation coefficients between variables were all between 0.30 and 0.60, p < 0.001; the results of multiple covariance test, VIF, were all < 2, with no significant covariance; the data were standardized and entered into the model analysis.
Hierarchical Regression and Hypothesis Testing
Hierarchical regression methods were used to sequentially control for demographic variables, gradually introducing core variables, interaction terms, and mediating terms. Table 6 presents the main regression results:
Table 6 demonstrates the results of the regression analysis of the critical path model constructed in this study and the validation of the corresponding hypotheses. Model M2 showed that NF beliefs were a significant positive predictor of PC (β = 0.33, p < 0.001, R² = 0.47), with 47% of explained variance, supporting hypothesis H2.
Model M5 showed that NF significantly enhanced JP (β = 0.30, p < 0.001, R² = 0.30), supporting H1a.
Model M9 showed that NF was also a significant positive predictor of organizational citizenship behavior (β = 0.36, p < 0.001, R² = 0.36), supporting H1b.
Model M6 validated the positive effect of PC on JP (β = 0.37, p < 0.001, R² = 0.37), supporting H3a facilitation (β = 0.37, p < 0.001, R² = 0.37), supporting H3a.
Model M10 further verified that PC had more explanatory power for organizational citizenship behavior (β = 0.49, p < 0.001, R² = 0.49), supporting H3b.
The moderating effect of the interaction term NF × POS on PC in Model M3 was significant (β = 0.16, p < 0.001, R² = 0.50), supporting H5, suggesting that POS enhanced the effect of fate beliefs on PC.
However, NF × POS in Model M7 did not predict JP significantly (β = −0.05, p = 0.402), and there was no growth in R² (∆R² = 0.00), suggesting that moderating effects did not hold true in this pathway, and did not support the hypothesis.
Together, these results validate most of the theoretical paths of the research model and set the stage for subsequent mediation and moderated mediation analyses.
Figure 3 demonstrates the path diagram for categorizing the prediction of whether a hospital employee will turnover or not based on the decision tree model. The model shows its strongest predictive power for turnover judgments by using Job Satisfaction as the primary segmentation variable; if an employee expresses satisfaction with his/her job, he/she is predicted not to turnover with an 84% probability (category 0), whereas if he/she is dissatisfied, the model predicts that he/she will not turnover 100% of the time, suggesting that there may be an overfitting of the path. Among satisfied employees, further stratification was achieved by variables such as whether or not they participated in practice (Practice), gender (Sex), veteran status (Veteran), and employment type (Employment Type) vs. race (Race). For example, for women, employees who have never served and are employed by the organization, the probability of turnover is only 34% for the White group, while it rises to 62% for other races; for male employees, the probability of turnover for those who have served is as high as 64%, and in some paths even 78%. Each node box is labeled with the predicted probability of turnover or not and the proportion of the sample at that node, and the overall model reveals the underlying mechanisms of employee turnover under multifactorial interactions, providing hospital administrators with clues for targeted staff retention interventions.

Fig. 3. Visualization of the path of the decision tree model to predict employee turnover in hospitals.
Talent Forecasting Performance
Figure 4 demonstrates the results of comparing the importance scores of each feature variable when using three ML models (Random Forest RF, Gradient Boosting Tree XGB, and Decision Tree DT) for hospital brain drain prediction on SMOTE oversampled processed data. Overall, Working Hour is shown to be a core predictor in all models, especially in the Random Forest (SMOTE_RF) and Decision Tree (SMOTE_DT) models, with a score of 1.00, indicating that it plays a dominant role in predicting employee turnover. In addition, Individual Income and Age also have high importance in the SMOTE_RF model (0.66 and 1.00, respectively), but are relatively weak in the XG Boost model, at 0.09 and 0.13, suggesting that their contribution to the nonlinear model is limited. Further comparisons revealed that Job Type (type of position) and EHR_EMR (whether or not to use electronic medical records) also had some explanatory power in the Random Forest model (both exceeding 0.6), while presenting marginal effects in the XGB and DT models. Practice (whether or not to participate in practice) and Employment Type (type of employment) ranked in the SMOTE_RF model ranked in the upper middle of the list, but were significantly less important in the other models.31

Fig. 4. Comparison of the importance of characteristic variables under different models. DT: decision tree; EHR: electronic h record; EMR: electronic medical record; RF: Random Forest; SMOTE: Synthetic Minority Class Oversampling Technique.
It is worth noting that although Job Satisfaction was the root node variable in the aforementioned decision tree path analysis, its importance in this figure was 0 in the SMOTE_DT (decision tree) model and only 0.00 in the XGB (eXtreme Gradient Boosting), suggesting that the satisfaction variable may have been marginalized in importance by the influence of other highly correlated variables in the current structure of data training. In addition, socio-demographic variables such as Sex (gender), Race (ethnicity), Degree (education), and Veteran generally had low weights in the three models, suggesting that these variables contribute less to the prediction of hospital employee turnover and may be more suitable as control variables rather than as primary explanatory factors.
Figure 5 consists of four subfigures showing the impact of different satisfaction or engagement dimensions on hospital employee turnover: including (a) Job Satisfaction, (b) Work Environment Satisfaction, (c) Relationship Satisfaction and (d) Job Involvement. Each subfigure presents the number of employees’ turnover (Attrition = Yes) and retention (Attrition = No) at different satisfaction levels in the form of stacked bar charts, supported by detailed data tables at the bottom. First, as can be seen in Figure 5(a), the higher the job satisfaction level, the lower the employee turnover rate.

Fig. 5. The subgroup analysis of the relationship between job-related satisfaction and employee turnover.
The low-satisfaction group (level 1) had a turnover rate of 22.8%, compared to 11.3% for the “very satisfied” group (level 4), indicating a significant protective effect of satisfaction on retention. Meanwhile, the highly satisfied group, although the largest in number (459), has the lowest turnover, accounting for only 21.9% of the total. Environmental satisfaction in Figure 5(b) shows a similar trend. The turnover rate among low environmental satisfaction employees is 25.4%, while the turnover rate for the very satisfied group drops to 13.5%. It indicates that a good working environment also contributes to employee stability. Figure 5(c) shows that relationship satisfaction also has an impact on turnover, but the magnitude is slightly lower than the previous two. In satisfaction levels 3 and 4, although the total number of employees is close, the turnover rate of level 3 (highly satisfied) is 15.5%, which is slightly higher than that of level 4 (very satisfied) at 14.8%. In Figure 5(d), job engagement has the most pronounced effect on attrition. The lowest commitment group (rank 1) has a high attrition rate of 33.7%, while the highest commitment group (rank 4) has only 9.0%, which is the most significant indicator of the difference in attrition among the four dimensions. Meanwhile, the group with the highest engagement level of 3 has the highest number of people and the highest turnover, accounting for 52.7% of the total turnover.
Figure 6 presents a combination of scatter and line graphs showing the attrition of hospital employees across Total Working Years and Monthly Income, with the trend in attrition rate (Attrition %) for each working year indicated by the black line. Each scatter in the figure represents one employee, where orange color indicates no attrition (Attrition = 0) and blue color indicates attrition (Attrition = 1). As can be observed in Figure 6, employee turnover is highest in the early years of employment (1 to 3 years), with more than 45% turnover in the first year. At this stage, although some employees have higher monthly income, most of them are concentrated in the lower income limit range, indicating that the lack of a match between salary and job may be the main reason for turnover. As the length of service grows to the 5th~10th year, employees’ income gradually increases, and the turnover rate generally shows a decreasing trend, reflecting increased career stability. However, in the range of 10~20 years of working experience, there are multiple dense distribution areas in the graph, with a large span of monthly income, but the turnover rate fluctuates irregularly, suggesting that mid-term employees’ willingness to turnover may rise again in the face of bottlenecks in job promotion, burnout, or external opportunities. It is worth noting that after more than 20 years of service, despite the generally higher income of employees, the proportion of turnover declined significantly, and most of the employees stayed on steadily, possibly with positions close to retirement.

Fig. 6. Graph analyzing the impact of total employee years of service and monthly earnings on turnover rate.
Figure 7 shows the distribution and trend of hospital employee turnover under different Hourly Rate and Total Working Years in a combination of scatterplot and line graph. Each point in the scatter plot represents an employee, with orange indicating no turnover (Attrition = 0) and blue indicating turnover (Attrition = 1). The black line represents the percentage of employee turnover at the corresponding hourly rate (Attrition %). Overall, the trend suggests that an increase in hourly wage does not have a clear linear effect in reducing turnover. In the range of $30–$60 hourly wage, the attrition rate is at a low to medium level with relatively small fluctuations. And from $61 or above, the turnover curve shows an obvious oscillating upward trend, and a number of turnover peaks, indicating that the tendency to turnover of some employees with high hourly wages is higher instead. Especially in the corresponding ranges of $65, $81, $88, and $100, the turnover rate exceeds 30%, suggesting that there is a characteristic of “high mobility and high job-hopping” among the high-wage group, which may be related to the scarcity of jobs, external attraction, or expiration of contracts.

Fig. 7. Analysis of the joint effect of hourly wage and length of service on turnover among hospital employees.
Figure 8 illustrates the joint distribution and interrelationships of hospital employees on five key continuous variables: Monthly Income, Job Level, Total Working Years, YearsAtCompany, and Years with CurrManager. The scatter dots of different colors in the figure indicate whether or not there is a turnover (red indicates turnover, blue indicates no turnover), the diagonal line is the kernel density distribution curve of each variable, and the off-diagonal line is the joint distribution relationship of scatter dots between variables, which can intuitively reveal the characteristics of the distribution of turnover of employees in the dimensions of different variables. From the diagonal density distribution curve, it can be observed that the density peaks of lost employees (red) in monthly income, job level, and total years of service are generally to the left, indicating that most of the lost employees are concentrated in the low-income, low job level and early career stage. Comparatively, the distribution of non-turnover employees is wider, with a higher proportion in higher income and length of service ranges, indicating that the willingness to turnover decreases with experience accumulation and job promotion.

Fig. 8. Plot of joint distribution of employee turnover with key continuous variables.
Figure 8 illustrates the joint distribution and interrelationships of hospital employees on five key continuous variables: Monthly Income, Job Level, Total Working Years, YearsAtCompany, and Years with CurrManager. The scatter dots of different colors in the figure indicate whether or not there is a turnover (red indicates turnover, blue indicates no turnover), the diagonal line is the kernel density distribution curve of each variable, and the off-diagonal line is the joint distribution relationship of scatter dots between variables, which can intuitively reveal the characteristics of the distribution of turnover of employees in the dimensions of different variables. From the diagonal density distribution curve, it can be observed that the density peaks of lost employees (red) in monthly income, job level, and total years of service are generally to the left, indicating that most of the lost employees are concentrated in the low-income, low job level and early career stage. Comparatively, the distribution of non-turnover employees is wider, with a higher proportion in higher income and length of service ranges, indicating that the willingness to turnover decreases with experience accumulation and job promotion.
Table 7 provides a comparison of the performance measures (Recall, F1-Score, Precision, and Accuracy) of the methods applied in the two papers, including Khalid et al.32 with the use of a multi-objective approach and Khalid and Wu33 with the use of query expansion and citation analysis, to the proposed method. With an accuracy of 92, our proposed method including the combination of ML models, such as Random Forest and XGBoost with the elements of psychology, is much higher than other approaches, with Khalid et al.32 at 83% and Khalid and Wu33 at 77% accuracy. This indicates the increased predictive capability and usability of our model in the case of hospital employee turnover.28,29
| Method | Recall (%) | F1-Score (%) | Precision (%) | Accuracy (%) |
| Khalid et al.: Multi-objective approach32 | 80 | 82 | 85 | 83 |
| Khalid & Wu: Query expansion & citation analysis33 | 75 | 78 | 80 | 77 |
| Our Proposed Method: Random Forest & XGBoost | 90 | 91 | 93 | 92 |
| F-measure: a measure of predictive performance. | ||||
Conclusions
This study presents a comprehensive, interdisciplinary approach to predicting hospital employee attrition, addressing both technical and psychological dimensions of the problem. On the technical side, we constructed a robust big data-driven platform capable of handling data imbalance through SMOTE and leveraging four distinct ML models to forecast employee departure. The use of performance metrics beyond accuracy (such as recall and F1-score) ensured fair evaluation in the presence of class imbalance, while feature importance analysis enabled interpretability and strategic insight for HR planning.
On the theoretical side, we enriched the prediction framework by incorporating NF, a culturally embedded belief, as a psychological antecedent to employee retention. Through validated questionnaires and multivariate analysis, we confirmed that NF exerts a significant positive impact on both JP and organizational citizenship behavior, mediated by PC. Furthermore, POS was shown to strengthen this pathway, establishing a moderated mediation structure. These findings align with and extend the attribution theory and locus of control literature into the domain of healthcare HR analytics.
Importantly, the combination of empirical ML and structural psychological modeling provides a dual-path predictive architecture—one that offers both algorithmic precision and human-centric explanation. This duality is essential for real-world application in hospital settings, where both quantitative insight and qualitative understanding are critical for designing effective talent retention strategies.
Future work may extend this framework by incorporating temporal data to forecast dynamic turnover risks, testing generalizability across multiple hospital types, and deploying the platform as a real-time HR decision-support system. Ultimately, this research underscores the value of integrating data science with human psychology to tackle complex workforce challenges in healthcare and beyond.
Contributions
Xiao Lei Zheng, Xiao Li Dai is responsible for designing the framework, analysing the performance, validating the results, and writing the article. Tian Li Liu is responsible for collecting the information required for the framework, provision of software, critical review, and administering the process.
Data Availability Statement (DAS), Data Sharing, Reproducibility, and Data Repositories
The datasets generated during the study are available from the corresponding author on reasonable request.
Application of AI-Generated Text or Related Technology
None.
References
- Zhou J, Li L, Su J. Leveraging big data in health care and public health for AI driven talent development in rural areas. Front Public Health. 2025;13:1524805. https://doi.org/10.3389/fpubh.2025.1524805
- Hariri A, Prasetio R, Al-Shammari A, Kara S. Leveraging big data analytics for talent management and prediction in human resources. J Soc Sci Util Technol. 2024;2(4):531–41.
- John AS, Hajam AA. Leveraging predictive analytics for enhancing employee engagement and optimizing workforce planning: a data-driven HR management approach. Int J Innov Manag Econ Soc Sci. 2024;4(4):33–41. https://doi.org/10.59615/ijimes.4.4.33
- Wale-Oshinowo BA, Majekodunmi SA. Workforce attrition and sustainable retention strategies in micro, small and medium-sized enterprises: trends and insights from the literature. J Manag Sci. 2024;61(9):177–94.
- Jasim WA, Alnajar HR, Hamid AS, Aldabagh DA, Shabala Y. The role of big data in predictive analytics: current trends and future directions. JoE. 2024;3(5):422–43. https://doi.org/10.62754/joe.v3i5.3915
- Basnet S. The impact of AI-driven predictive analytics on employee retention strategies. Int J Res Rev. 2024;11:50–65. https://doi.org/10.52403/ijrr.20240906
- Nwoke J. Harnessing predictive analytics, ML, and scenario modeling to enhance enterprise-wide strategic decision-making. Int J Comput Appl Technol Res. 2025;14(4):1010. https://doi.org/10.7753/IJCATR1404
- Marumolwa L, Maota T. Leveraging big data analysis for sustaining and improving employee retention. In: Sustainable management practices for employee retention and recruitment. IGI Global Scientific Publishing; 2025. p. 199–232. https://doi.org/10.4018/979-8-3693-8679-8.ch010
- Mangrulkar RS, Chavan PV. Introduction to analytics. In: Predictive analytics with SAS and R: core concepts, tools, and implementation. Berkeley, CA: Apress; 2025. p. 1–30.
- Bhagat R, Ukunde S. Leveraging strategic human resource practices through advanced business analytics to enhance organizational effectiveness: a case study of Varron Autokast Ltd., Nagpur. Int J Innov Stud. 2025;9(1):281–94. https://doi.org/10.1007/978-3-032-06665-7_1
- Zhu Z, Zheng W, Tang N, Zhong W. Review of manpower management in healthcare system: strategies, challenges, and innovations. J Multidiscip Healthc. 2024;2024:5341–51. https://doi.org/10.2147/JMDH.S497932
- Nayak A, Patnaik A, Satpathy I, Khang A, Patnaik BCM. The power of artificial intelligence in talent recruitment revolution: creating a smarter workforce. In: AI-oriented competency framework for talent management in the digital economy. CRC Press; 2024. p. 54–75.
- Husnain A. A comprehensive review of employee performance, big data, fraud detection, and security innovations: the role of rewards, training, AI, and block chain in banking, healthcare, petroleum, and cloud infrastructure. Algo Vista J AI Comput Sci. 2024;2(3):16–35.
- Kumar A, Sadashiva DN. The synergy of artificial intelligence and big data analytics in accelerating drug discovery: from target identification to clinical trials. Int J Environ Sci. 2025;161–79.
- De Novi G, Sofia N, Vasiliu-Feltes I, Yan Zang C, Ricotta F. Blockchain technology predictions 2024: transformations in healthcare, patient identity and public health. Blockchain Healthc Today. 2023;6(2). https://doi.org/10.30953/bhty.v6.287
- Jayaprakasam BC, Cindhamani J. AI and big data-driven m-health: integrating cloud computing, remote patient monitoring, clinical decision support systems, and self-supervised learning with FHIR for scalable healthcare systems. Indo-Am J Life Sci Biotechnol. 2025 [cited 2025 Jul 1];22(1). Available from: https://iajlb.org/index.php/iajlb/article/view/171
- Madanchian M. From recruitment to retention: AI tools for human resource decision-making. Appl Sci. 2024;14(24):11750. https://doi.org/10.3390/app142411750
- Rigamonti E, Gastaldi L, Corso M. Measuring HR analytics maturity: supporting the development of a roadmap for data-driven human resources management. Manag Decis. 2024;62(13):243–82. https://doi.org/10.1108/MD-11-2023-2087
- Naresh KRP. Forecasting E-commerce trends: utilizing linear regression, polynomial regression, random forest, and gradient boosting for accurate sales and demand prediction. Int J HRM Org Behav. 2023;11(3). https://doi.org/10.62650/ijhrmob.2023.v11.i03.pp15-28
- Damar M., Aydin O, Erenay FS. Blockchain applications in core healthcare services: patient data, research, and institutional processes. Blockchain Healthcare Today. 2025;8(2). https://doi.org/10.30953/bhty.v8.408
- Zhang C, Shan G, Roh B. Fair federated learning for multi-task 6G NWDAF network anomaly detection. IEEE Trans Intell Transp Syst. 2024. https://doi.org/10.1109/TITS.2024.3461679
- Singh K. Smart, safe, and strategic: transforming HR data into actionable insights without compromising security. Eastasouth J Inf Syst Comput Sci. 2025;2(3):391–8. https://doi.org/10.58812/esiscs.v2i03.537
- Lu S, Ba L, Wang J, Zhou M, Huang P, Zhang X, et al. Deep learning-driven approach for cataract management: towards precise identification and predictive analytics. Front Cell Dev Biol. 2025;13:1611216. https://doi.org/10.3389/fcell.2025.1611216
- Vadithe RN, Kesari B. Role of technology enablers for implementation of HR analytics in the Indian IT sector: a mediation analysis. Hum Syst Manag. 2025;44:1–17. https://doi.org/10.1177/01672533251314403
- Yuksel BB, Metin AY. Data-driven breakthroughs and future directions in AI infrastructure: a comprehensive review. arXiv Prepr. 2025;arXiv:2505.16771. https://doi.org/10.48550/arXiv.2505.16771
- Chen L, Nath R, Rocco N. Key issues of predictive analytics implementation: a sociotechnical perspective. J Int Technol Inf Manag. 2024;32(1):239–70. https://doi.org/10.58729/1941-6679.1565
- Xie H, Zhao Z. The analysis of entrepreneurship evaluation system for talent cultivation in artistic creativity and animation under artificial intelligence. Sci Rep. 2025;15(1):1–17. https://doi.org/10.1038/s41598-025-01437-w
- Rahmani S, Aghalar H, Jebreili S, Goli A. Optimization and computing using intelligent data-driven approaches for decision-making. In: optimization and computing using intelligent data-driven approaches for decision-making. CRC Press; 2025. p. 90–176.
- Ghosh UK. Transformative AI applications in business decision-making: advancing data-driven strategies and organizational intelligence. In: AI-powered leadership: transforming organizations in the digital age. IGI Global Scientific Publishing; 2025. p. 1–40.
- Kumar S, Aithal PS. Disruptive innovations using tech-business analytics in the tertiary industry sector. Poorna Prajna Int J Emerg Technol. 2025;2(1):1–25. https://doi.org/10.64818/PIJET.3107.8486.0011
- Zhou H, et al. Towards high accuracy pedestrian detection on edge GPUs. Sensors (Basel). 2022;22(16):5980. https://doi.org/10.3390/s22165980
- Khalid S, Wu S, Zhang F. A multi-objective approach to determining the usefulness of papers in academic search. Data Technol Appl. 2021;55(5):734–48. https://doi.org/10.1108/DTA-05-2020-0104
- Khalid S, Wu S. Supporting scholarly search by query expansion and citation analysis. Eng Technol Appl Sci Res. 2020;10(4):6102–8. https://doi.org/10.48084/etasr.3655
Copyright Ownership: This is an open-access article distributed in accordance with the Creative Commons Attribution Non-Commercial (CC BY-NC 4.0) license, which permits others to distribute, adapt, enhance this work non-commercially, and license their derivative works on different terms, provided the original work is properly cited and the use is non-commercial. See http://creativecommons.org/licenses/by-nc/4.0. The authors of this article own the copyright.